GCPでマイクロサービスを運用していると、「どのリクエストがどこで遅延しているのか」「エラーの発生元はどのサービスか」の把握が困難になります。OpenTelemetryはこの課題を解決するオブザーバビリティの業界標準フレームワークで、Google Cloudは2025年以降、OTLP(OpenTelemetry Protocol)のネイティブ対応を急速に進めています。
OpenTelemetryの基本構成とGCPにおける位置づけ
OpenTelemetryはCNCF(Cloud Native Computing Foundation)が管理するオープンソースプロジェクトで、トレース・メトリクス・ログの3つのテレメトリデータを統一的に扱えます。ベンダーロックインを回避しつつ、高品質なオブザーバビリティ基盤を構築できる点が最大の強みです。
GCP環境におけるOpenTelemetryの構成要素は次の3つです。
| 構成要素 | 役割 | GCPでの対応サービス |
|---|---|---|
| SDK(計装ライブラリ) | アプリケーションコードにトレース・メトリクスを埋め込む | 各言語のOpenTelemetry SDK |
| Collector | テレメトリデータの受信・加工・転送を担うミドルウェア | Google-Built OpenTelemetry Collector |
| バックエンド | データの保存・可視化・分析 | Cloud Trace / Cloud Monitoring / Cloud Logging |
従来はGCP固有のエクスポータ(opentelemetry-exporter-gcp-trace など)が必要でしたが、telemetry.googleapis.com エンドポイントの提供により、標準の OTLP HTTP エクスポータで直接送信できるようになっています。
OTLP直接取り込み:telemetry.googleapis.com の活用
Google Cloud Observabilityは telemetry.googleapis.com をOTLPエンドポイントとして提供しています。このエンドポイントにより、ベンダー固有のエクスポータを使わずに、標準のOTLPプロトコルでトレースとメトリクスを送信できます。
対応状況
| テレメトリ種別 | 対応状況 | 備考 |
|---|---|---|
| トレース | GA(一般提供) | Cloud Traceに取り込み |
| メトリクス | プレビュー | Cloud Monitoringに取り込み。OpenTelemetry Collector 0.140.0以降が必要 |
| ログ | 未対応 | telemetry.googleapis.com経由の直接取り込みは未提供。Cloud Logging APIまたはgooglecloudエクスポータを使用 |
2026年3月以降、Cloud Trace API・Cloud Monitoring APIなどが有効なプロジェクトでは telemetry.googleapis.com エンドポイントが自動的にアクティブになる予定です。
OTLP直接取り込みのメリット
従来の方式(GCP固有エクスポータ経由)と比較した利点は3つあります。
- ベンダーロックインの排除: 同じ計装コードでDatadogやGrafana Cloudなど他のバックエンドにも送信可能
- 属性サイズの拡張: 属性キーが最大512バイト(従来128バイト)、属性値が最大64KiB(従来256バイト)、スパン名が最大1,024バイト
- Collector不要の軽量構成: 高ボリューム環境ではSDKから直接エンドポイントに送信でき、Collectorの運用負荷を削減
Collector経由での設定例
OpenTelemetry Collectorから telemetry.googleapis.com に送信する場合の設定です。
extensions:
  googleclientauth:

exporters:
  otlphttp:
    encoding: proto
    endpoint: https://telemetry.googleapis.com
    auth:
      authenticator: googleclientauth

service:
  extensions: [googleclientauth]
  pipelines:
    traces:
      receivers: [otlp]
      processors: [batch, resourcedetection]
      exporters: [otlphttp]
    metrics:
      receivers: [otlp]
      processors: [batch, resourcedetection]
      exporters: [otlphttp]
googleclientauth エクステンションはGCPのApplication Default Credentials(ADC)を使用して自動認証を行います。GKEのWorkload Identity FederationやCloud Runのサービスアカウントにも対応しています。
GCPサービス別のOpenTelemetry実装パターン
Cloud Run:サイドカーコンテナによるCollectorデプロイ
Cloud Runではマルチコンテナ(サイドカー)機能を使い、アプリケーションコンテナの隣にOpenTelemetry Collectorをデプロイするのが推奨パターンです。
# service.yaml
apiVersion: serving.knative.dev/v1
kind: Service
metadata:
  name: my-app
  annotations:
    run.googleapis.com/launch-stage: BETA
spec:
  template:
    metadata:
      annotations:
        run.googleapis.com/container-dependencies: '{"my-app":["otel-collector"]}'
    spec:
      containers:
        - image: my-app-image:latest
          name: my-app
          ports:
            - containerPort: 8080
          env:
            - name: OTEL_EXPORTER_OTLP_ENDPOINT
              value: "http://localhost:4318"
        - image: us-docker.pkg.dev/cloud-ops-agents-artifacts/google-cloud-opentelemetry-collector/otelcol-google:0.143.0
          name: otel-collector
          startupProbe:
            httpGet:
              path: /
              port: 13133
Google提供の otelcol-google イメージはGKE・Cloud Run・Compute Engineなど各種GCP環境で共通して利用でき、リソース検出やバッチ処理が事前設定済みです。
ポイント:
container-dependenciesアノテーションでCollectorがアプリより先に起動するよう制御- アプリケーションからは
localhost:4318(OTLP HTTP)宛にテレメトリを送信 - Collectorが
telemetry.googleapis.comまたはGCP固有エクスポータへ転送
GKE:DaemonSetまたはSidecarパターン
GKE環境ではDaemonSetとSidecarの2つのデプロイパターンがあります。
| パターン | 適用場面 | メリット | デメリット |
|---|---|---|---|
| DaemonSet | ノード数が少ない〜中規模クラスタ | リソース効率が良い、一括管理しやすい | ノード間で負荷が偏る可能性 |
| Sidecar | Pod単位でテレメトリを制御したい場合 | 障害分離性が高い、Pod単位の設定が可能 | リソース消費が増える |
DaemonSetパターンでのデプロイ例です。
apiVersion: apps/v1
kind: DaemonSet
metadata:
  name: otel-collector
  namespace: monitoring
spec:
  selector:
    matchLabels:
      app: otel-collector
  template:
    metadata:
      labels:
        app: otel-collector
    spec:
      serviceAccountName: otel-collector-sa
      containers:
        - name: otel-collector
          image: otel/opentelemetry-collector-contrib:latest
          ports:
            - containerPort: 4317  # gRPC
            - containerPort: 4318  # HTTP
          volumeMounts:
            - name: config
              mountPath: /etc/otelcol-contrib
      volumes:
        - name: config
          configMap:
            name: otel-collector-config
GKEではWorkload Identity Federationを有効にすることで、サービスアカウントキーなしでCloud Trace・Cloud Monitoringへの書き込み権限を付与できます。
# Kubernetes ServiceAccountとGCP IAMの紐付け
gcloud iam service-accounts add-iam-policy-binding \
  otel-sa@PROJECT_ID.iam.gserviceaccount.com \
  --role roles/iam.workloadIdentityUser \
  --member "serviceAccount:PROJECT_ID.svc.id.goog[monitoring/otel-collector-sa]"
Cloud Functions:短命プロセスでの計装の注意点
Cloud Functionsは関数実行が短時間で終了するため、テレメトリデータの送信に注意が必要です。米国ではCloud FunctionsへのOpenTelemetry適用事例が多く、第1世代と第2世代で実装方法が異なります。
第1世代 Cloud Functions:
- リクエスト/レスポンス型で実行時間が短い
SimpleSpanProcessor(同期送信)を使用しないと、スパンが送信前に関数が終了するBatchSpanProcessorは使用不可
第2世代 Cloud Functions(Cloud Runベース):
- Cloud Runと同じインフラで動作するため、
BatchSpanProcessorも利用可能 - 環境変数
OTEL_EXPORTER_OTLP_ENDPOINTで送信先を設定
Node.jsでの第2世代Cloud Functions計装例です。
// tracing.js - モジュールロード時に初期化
const { NodeSDK } = require('@opentelemetry/sdk-node');
const { OTLPTraceExporter } = require('@opentelemetry/exporter-trace-otlp-http');
const { getNodeAutoInstrumentations } = require('@opentelemetry/auto-instrumentations-node');
const { Resource } = require('@opentelemetry/resources');
const { ATTR_SERVICE_NAME } = require('@opentelemetry/semantic-conventions');

const sdk = new NodeSDK({
  resource: new Resource({
    [ATTR_SERVICE_NAME]: process.env.K_SERVICE || 'my-function',
  }),
  traceExporter: new OTLPTraceExporter({
    url: process.env.OTEL_EXPORTER_OTLP_ENDPOINT || 'http://localhost:4318/v1/traces',
  }),
  instrumentations: [getNodeAutoInstrumentations()],
});

sdk.start();
// index.js
require('./tracing');
const functions = require('@google-cloud/functions-framework');

functions.http('myFunction', (req, res) => {
  // 自動計装により HTTP リクエストのスパンが生成される
  res.send('Hello from instrumented function!');
});
Collector構成の実践的な設定ガイド
レシーバー・プロセッサ・エクスポータの全体像
OpenTelemetry Collectorのパイプラインは、Receiver → Processor → Exporterの順にデータが流れます。
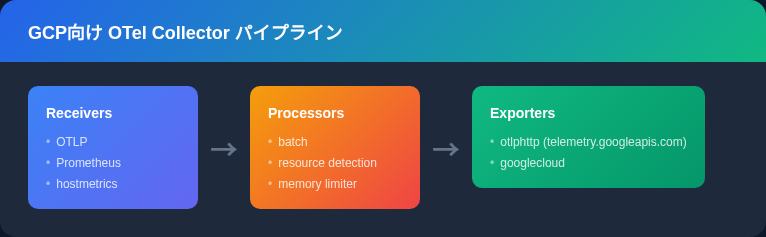
GCP向け推奨Collector構成
以下は、GKE環境での実運用を想定したCollector構成の全体例です。
receivers:
  otlp:
    protocols:
      grpc:
        endpoint: 0.0.0.0:4317
      http:
        endpoint: 0.0.0.0:4318
  prometheus:
    config:
      scrape_configs:
        - job_name: 'app-metrics'
          scrape_interval: 30s
          static_configs:
            - targets: ['localhost:9090']

processors:
  batch:
    send_batch_size: 200
    timeout: 5s
  memory_limiter:
    check_interval: 1s
    limit_mib: 512
    spike_limit_mib: 128
  resourcedetection:
    detectors: [env, gcp]
    timeout: 5s
    override: false
  resource:
    attributes:
      - key: service.namespace
        value: "production"
        action: upsert

exporters:
  otlphttp:
    encoding: proto
    endpoint: https://telemetry.googleapis.com
    auth:
      authenticator: googleclientauth

extensions:
  googleclientauth:
  health_check:
    endpoint: 0.0.0.0:13133

service:
  extensions: [googleclientauth, health_check]
  pipelines:
    traces:
      receivers: [otlp]
      processors: [memory_limiter, batch, resourcedetection, resource]
      exporters: [otlphttp]
    metrics:
      receivers: [otlp, prometheus]
      processors: [memory_limiter, batch, resourcedetection, resource]
      exporters: [otlphttp]
    logs:
      receivers: [otlp]
      processors: [memory_limiter, batch, resourcedetection, resource]
      exporters: [otlphttp]
設定のポイント:
memory_limiterはパイプラインの先頭に配置し、OOM(Out of Memory)を防止resourcedetectionのgcpディテクタは、GCE・GKE・Cloud Run環境を自動検出してリソース属性を付与batchプロセッサでAPI呼び出し回数を削減し、コストを抑制- Prometheusレシーバーとの併用で、既存のPrometheus計装を移行なしで取り込み可能
サンプリング戦略でコストを最適化する
テレメトリデータの量が増えるほどCloud TraceやCloud Monitoringの料金が上がります。Collectorのサンプリング設定でコストと可視性のバランスを取ることが重要です。
processors:
  # 確率的サンプリング: 10%のトレースのみ保持
  probabilistic_sampler:
    sampling_percentage: 10

  # Tail-based サンプリング: エラーや高レイテンシのトレースを優先保持
  tail_sampling:
    decision_wait: 10s
    policies:
      - name: errors-policy
        type: status_code
        status_code: {status_codes: [ERROR]}
      - name: latency-policy
        type: latency
        latency: {threshold_ms: 1000}
      - name: probabilistic-policy
        type: probabilistic
        probabilistic: {sampling_percentage: 5}
Tail-basedサンプリングは正常なリクエストを間引きつつ、エラーや遅延が大きいトレースは100%保持するため、障害調査に必要な情報を確保しながらコストを大幅に削減できます。
GCP Observability料金の目安
OpenTelemetryのデータ送信先となるCloud TraceとCloud Monitoringの料金体系を把握しておくと、サンプリング設定の判断基準になります。
| サービス | 無料枠 | 無料枠超過後の料金 |
|---|---|---|
| Cloud Trace | 月250万スパン / 請求アカウント | $0.20 / 100万スパン |
| Cloud Monitoring(バイト課金) | 150 MiB / 請求アカウント(課金対象メトリクスのみ) | $0.258/MiB(〜10万MiB)、以降逓減 |
| Cloud Monitoring(Prometheus) | なし | $0.06/100万サンプル(〜500億サンプル)、以降逓減 |
(出典: Google Cloud Observability Pricing)
コスト試算の例:
1日あたり1,000万スパンを生成するサービスの場合、月間約3億スパンとなり、無料枠250万を差し引いた2億9,750万スパンに対して約$59.50/月のCloud Trace費用が発生します。Tail-basedサンプリングでエラーと高レイテンシのみ保持し、正常トレースを5%にすれば、月間約1,700万スパンまで削減可能で、料金は約$2.90/月に抑えられます。
Python・Go・Node.jsでの計装コード比較
Python(Flask + Cloud Run)
from opentelemetry import trace
from opentelemetry.sdk.trace import TracerProvider
from opentelemetry.sdk.trace.export import BatchSpanProcessor
from opentelemetry.exporter.otlp.proto.http.trace_exporter import OTLPSpanExporter
from opentelemetry.sdk.resources import Resource
from opentelemetry.instrumentation.flask import FlaskInstrumentor
from opentelemetry.instrumentation.requests import RequestsInstrumentor
from flask import Flask

# リソース定義
resource = Resource.create({
    "service.name": "order-service",
    "service.namespace": "production",
    "deployment.environment": "prod",
})

# TracerProvider初期化
provider = TracerProvider(resource=resource)
processor = BatchSpanProcessor(
    OTLPSpanExporter()  # OTEL_EXPORTER_OTLP_ENDPOINT 環境変数を参照
)
provider.add_span_processor(processor)
trace.set_tracer_provider(provider)

# Flask自動計装
app = Flask(__name__)
FlaskInstrumentor().instrument_app(app)
RequestsInstrumentor().instrument()

tracer = trace.get_tracer(__name__)

@app.route("/orders/<order_id>")
def get_order(order_id):
    with tracer.start_as_current_span("fetch-order-detail") as span:
        span.set_attribute("order.id", order_id)
        # DB呼び出しなどのビジネスロジック
        return {"order_id": order_id, "status": "confirmed"}
Go(net/http + GKE)
package main

import (
	"context"
	"log"
	"net/http"

	"go.opentelemetry.io/otel"
	"go.opentelemetry.io/otel/exporters/otlp/otlptrace/otlptracehttp"
	"go.opentelemetry.io/otel/sdk/resource"
	sdktrace "go.opentelemetry.io/otel/sdk/trace"
	semconv "go.opentelemetry.io/otel/semconv/v1.26.0"
	"go.opentelemetry.io/contrib/instrumentation/net/http/otelhttp"
)

func initTracer() func() {
	ctx := context.Background()
	exporter, err := otlptracehttp.New(ctx)
	if err != nil {
		log.Fatalf("failed to create exporter: %v", err)
	}

	res, _ := resource.Merge(
		resource.Default(),
		resource.NewWithAttributes(
			semconv.SchemaURL,
			semconv.ServiceName("payment-service"),
			semconv.DeploymentEnvironmentName("production"),
		),
	)

	tp := sdktrace.NewTracerProvider(
		sdktrace.WithBatcher(exporter),
		sdktrace.WithResource(res),
	)
	otel.SetTracerProvider(tp)

	return func() { tp.Shutdown(ctx) }
}

func main() {
	shutdown := initTracer()
	defer shutdown()

	handler := http.HandlerFunc(func(w http.ResponseWriter, r *http.Request) {
		tracer := otel.Tracer("payment-service")
		_, span := tracer.Start(r.Context(), "process-payment")
		defer span.End()

		w.Write([]byte("payment processed"))
	})

	wrappedHandler := otelhttp.NewHandler(handler, "server")
	log.Fatal(http.ListenAndServe(":8080", wrappedHandler))
}
Node.js(Express + Cloud Run)
// tracing.js
const { NodeSDK } = require('@opentelemetry/sdk-node');
const { OTLPTraceExporter } = require('@opentelemetry/exporter-trace-otlp-http');
const { OTLPMetricExporter } = require('@opentelemetry/exporter-metrics-otlp-http');
const { PeriodicExportingMetricReader } = require('@opentelemetry/sdk-metrics');
const { getNodeAutoInstrumentations } = require('@opentelemetry/auto-instrumentations-node');
const { Resource } = require('@opentelemetry/resources');
const { ATTR_SERVICE_NAME } = require('@opentelemetry/semantic-conventions');

const sdk = new NodeSDK({
  resource: new Resource({
    [ATTR_SERVICE_NAME]: process.env.K_SERVICE || 'user-service',
  }),
  traceExporter: new OTLPTraceExporter(),
  metricReader: new PeriodicExportingMetricReader({
    exporter: new OTLPMetricExporter(),
    exportIntervalMillis: 30000,
  }),
  instrumentations: [getNodeAutoInstrumentations({
    '@opentelemetry/instrumentation-fs': { enabled: false },
  })],
});

sdk.start();
process.on('SIGTERM', () => sdk.shutdown());
// app.js
require('./tracing');
const express = require('express');
const { trace } = require('@opentelemetry/api');

const app = express();
const tracer = trace.getTracer('user-service');

app.get('/users/:id', async (req, res) => {
  const span = tracer.startSpan('fetch-user-profile');
  span.setAttribute('user.id', req.params.id);
  try {
    // ビジネスロジック
    res.json({ id: req.params.id, name: 'example' });
  } finally {
    span.end();
  }
});

app.listen(8080);
3言語とも OTEL_EXPORTER_OTLP_ENDPOINT 環境変数でCollectorのアドレスを指定します。Cloud Run環境ではサイドカーCollectorの http://localhost:4318 を設定するだけで、認証やリソース属性の付与はCollector側で自動処理されます。
分散トレーシングのトラブルシューティング
GCP環境でOpenTelemetryを導入した際によく遭遇する問題と対処法をまとめます。
トレースがCloud Traceに表示されない
確認手順:
- API有効化の確認:
cloudtrace.googleapis.comとmonitoring.googleapis.comが有効か確認
gcloud services list --enabled --filter="name:cloudtrace.googleapis.com OR name:monitoring.googleapis.com"
- IAM権限の確認: サービスアカウントに
roles/cloudtrace.agentとroles/monitoring.metricWriterが付与されているか確認
gcloud projects get-iam-policy PROJECT_ID \
  --flatten="bindings[].members" \
  --filter="bindings.members:serviceAccount:SA_NAME@PROJECT_ID.iam.gserviceaccount.com"
- Collectorログの確認: Collectorのデバッグログを有効にしてエクスポートの成否を確認
service:
  telemetry:
    logs:
      level: debug
スパンが途切れて分散トレースが繋がらない
サービス間でTrace Contextが伝播されていない場合に発生します。
- HTTPヘッダの確認:
traceparentヘッダが伝播しているか確認。W3C Trace Context形式(00-{trace-id}-{span-id}-{flags})でなければならない - GCPサービス経由の場合: Cloud Load BalancerやCloud Pub/Subを経由するとTrace Contextが欠落することがあります。OTTL(OpenTelemetry Transformation Language)でスパンの親子関係を再構築する方法が有効です
- gRPCの場合: メタデータ経由でContextが伝播されるため、
otelgrpcインターセプターの設定を確認
Cloud FunctionsでSpanが送信されない
第1世代Cloud Functionsでは関数終了時にプロセスが即座に停止するため、非同期のBatchSpanProcessorではスパンの送信が間に合わないことがあります。
# NG: BatchSpanProcessor(第1世代では送信前に終了する可能性)
from opentelemetry.sdk.trace.export import BatchSpanProcessor

# OK: SimpleSpanProcessor(同期送信で確実に送信)
from opentelemetry.sdk.trace.export import SimpleSpanProcessor
第2世代Cloud FunctionsはCloud Runベースのため、この問題は発生しません。新規構築の場合は第2世代の利用を推奨します。
GCP固有エクスポータとOTLP直接送信の選択基準
現在GCPへテレメトリを送信する方法は2つあります。
| 項目 | GCP固有エクスポータ | OTLP直接送信(telemetry.googleapis.com) |
|---|---|---|
| 設定の容易さ | ライブラリ追加が必要 | 標準OTLPエクスポータで動作 |
| マルチバックエンド対応 | GCP専用 | 同じ計装でDatadog、Grafanaなどにも送信可 |
| 属性サイズ制限 | 従来の制限(128バイト等) | 拡張された制限(512バイト等) |
| 成熟度 | 安定稼働の実績が豊富 | GA済み(トレース)、メトリクスはプレビュー、ログは未対応 |
| 推奨ケース | 既存環境の維持 | 新規構築、マルチクラウド構成 |
Googleの公式ドキュメントでは、新規ユーザーや高ボリューム環境では telemetry.googleapis.com へのOTLP直接送信が推奨されています。既存環境からの移行ガイドもGoogle Cloud公式ドキュメントに用意されています。
Prometheusメトリクスとの統合
既存のPrometheus計装を維持しつつCloud Monitoringにデータを送信するには、CollectorのPrometheusレシーバーを使用します。
receivers:
  prometheus:
    config:
      scrape_configs:
        - job_name: 'my-app'
          scrape_interval: 15s
          kubernetes_sd_configs:
            - role: pod
          relabel_configs:
            - source_labels: [__meta_kubernetes_pod_annotation_prometheus_io_scrape]
              action: keep
              regex: true
            - source_labels: [__meta_kubernetes_pod_annotation_prometheus_io_port]
              action: replace
              target_label: __address__
              regex: (.+)
              replacement: $${1}:$$2
この構成により、アプリケーションコードを変更せずにPrometheusメトリクスをCloud Monitoringに送信できます。Cloud MonitoringではPrometheusメトリクスをManaged Service for Prometheus(GMP)として保存し、PromQLクエリも利用可能です。
まとめ
OpenTelemetryとGCPの組み合わせは、telemetry.googleapis.com エンドポイントの提供により大きく簡素化されています。Cloud Run・GKE・Cloud Functionsいずれの環境でも、標準のOTLPプロトコルでCloud Trace・Cloud Monitoring・Cloud Loggingにテレメトリを集約できます。
実運用で押さえるべきポイントは3つです。
- Collectorの適切な配置: Cloud Runではサイドカー、GKEではDaemonSetまたはSidecar、Cloud FunctionsではSDK直接送信
- サンプリングによるコスト制御: Tail-basedサンプリングでエラーと高レイテンシを優先保持し、正常トレースを間引く
- 認証とIAM設計: Workload Identity FederationやApplication Default Credentialsを活用し、サービスアカウントキーの管理を避ける
2026年3月以降、対象プロジェクトでは telemetry.googleapis.com が自動有効化される予定のため、今から新規構築する場合はOTLP直接送信をベースにした構成を選択するのが合理的です。